
By Cory McPherson
February 2026
We’ve seen a tight sideways grind in the S&P 500 to start 2026, and not much change since late October last year. While this could be a consolidation pattern that leads the market to eventually continue the prior trend (up), the market leaders/big technology stocks are not acting the same way. Much of the stock market over the last 10+ years has been dominated by the big technology stocks. The “Magnificent 7” tech stocks make up such a large portion (over 30%) of the S&P 500 that such a small group of stocks can have a large influence on the direction of the broad market. They are the leaders, the generals of the market, but they have not been leading the way recently. I’ll get into the good and the bad with what we’re seeing with this group of stocks.
The “Magnificent 7” group consists of Alphabet (Google), Amazon, Apple, Meta, Microsoft, Nvidia, and Tesla. These names are among the largest market caps in the S&P 500 as well as some of the best performers of the last 10 years. Much of the broad market’s gains can be attributed to these companies. Because of their large influence on the market and S&P 500 index, it’s important to note what we’ve been seeing recently.
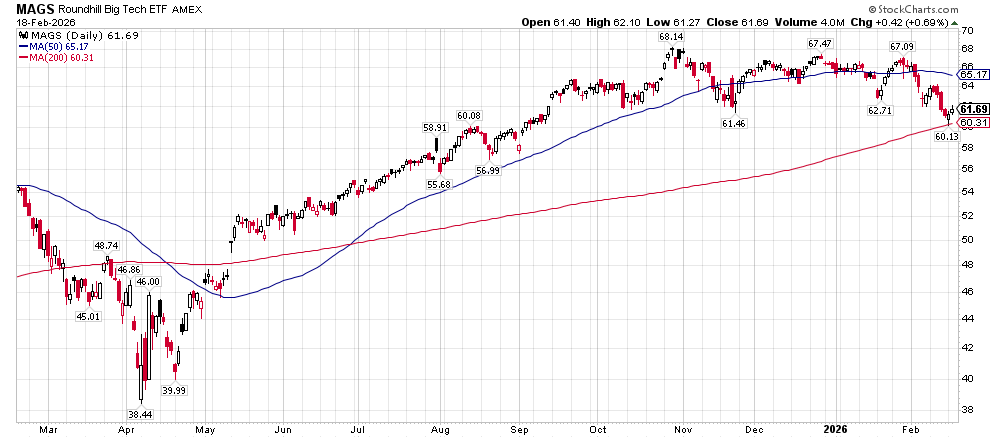
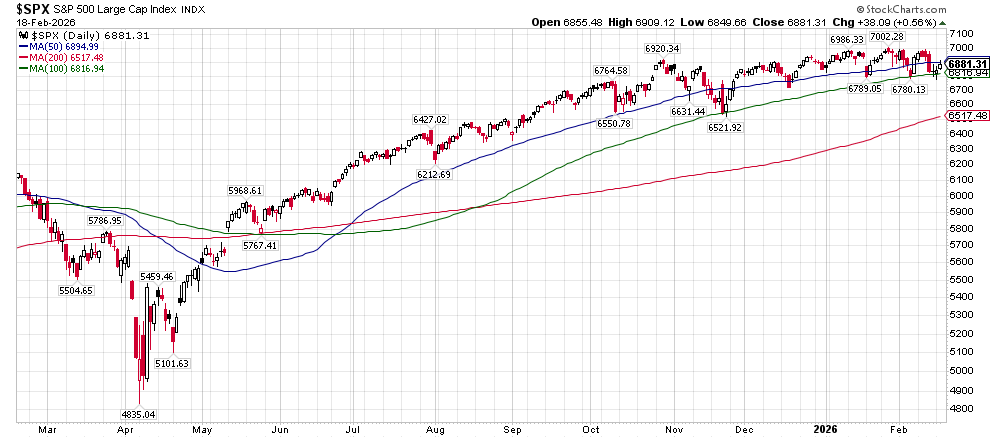
A simple way to look at these stocks together is through the exchange traded fund MAGS, which holds just these 7 stocks at an equal weight. You can see in the chart below how it peaked in late October and has since made lower highs on subsequent rallies. The second chart below is the S&P 500 over the same period. You can see it has made new highs since October even while trading in a sideways fashion. Currently, the MAGS fund is sitting just above its 200-day moving average. If it is about to turn around, this would be a logical place to start from. The S&P 500 meanwhile has poked below its shorter-term averages recently but has held its 100-day moving average and remains over 5% above its 200-day moving average.
The positive when seeing this is that while money is rotating out of some of the big tech stocks, it is finding a home in other parts of the stock market. This rotation has led to the broad index staying elevated while the big tech stocks turn down. Basically, the other 493 stocks are holding up while the top 7 have been struggling. Broad market rallies are much healthier and have more staying power typically than narrow ones, which would be a positive sign if this sideways consolidation results in an upward breakout soon.
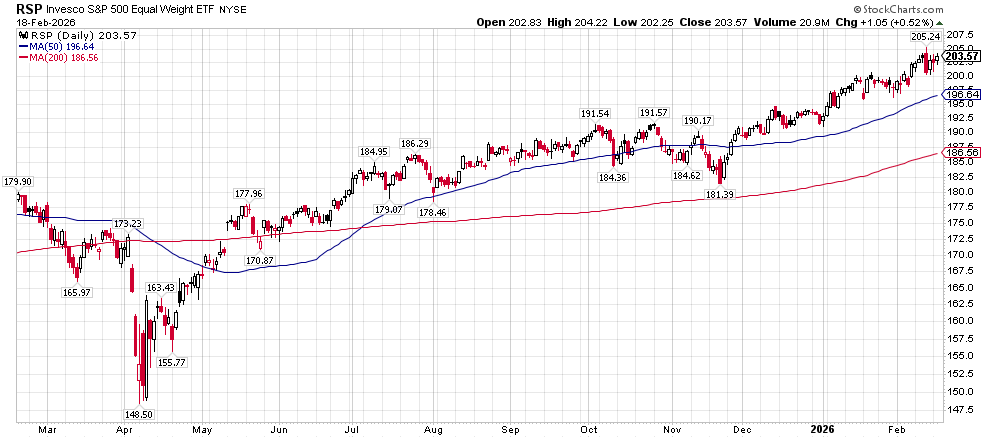
Another way to look at this divergence between the big tech stocks and the rest of the market is through another ETF, an equal-weight S&P 500 fund. This uses the same stocks within the S&P 500 but has them each weighted equally. Whereas the S&P 500 index is weighted by the market cap of each stock. And as stated, the magnificent 7 stocks have over a 30% share of the weight. You can see below how this equal weight ETF has had a nice uptrend since November, and is off to a great start in 2026.
While some of the defensive areas of the stock market have benefitted from this rotation, we’ve also seen cyclical and economically sensitive areas perform well. Defensive areas of the market include sectors like consumer staples and utilities. The cyclical areas that have performed well this year include industrials, materials, and energy. Each of those sectors has been among the best performers to start 2026. The fact that the economically sensitive areas have been performing well gives evidence of the expectation for the economy to continue to grow and money continuing to be spent.
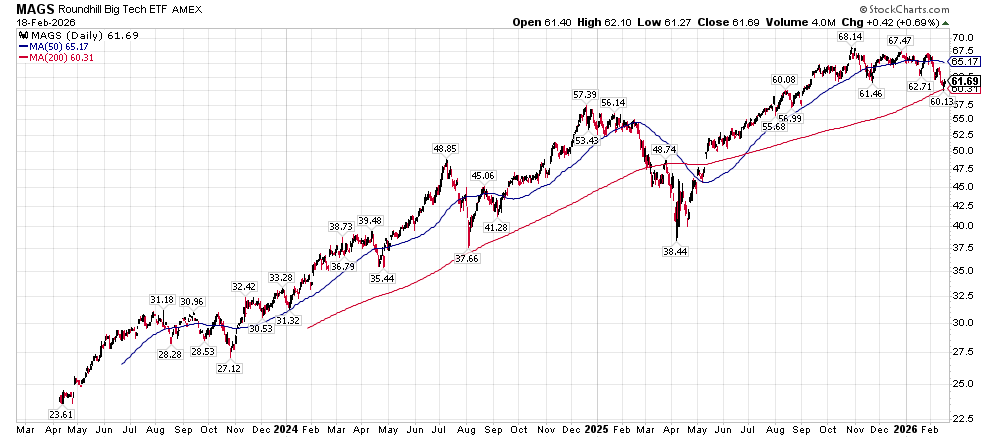
Now the drawback is, if these market generals don’t start to perform, their sheer weight can eventually drag everything down. They have been leaders to the upside, and also to the downside at times. We’ve seen periods like this in recent history where the broad market stays near its highs and the big tech stocks peak and begin to trend down beforehand. What starts out looking like healthy rotation ends up resulting in some sort of correction and drawdown in the indexes. We don’t even have to look back very far to see an example. The chart below shows that from just a year ago we saw the MAGS ETF peak in December 2024 and make a series of lower highs over the next 2 months. The S&P 500 meanwhile chopped in a sideways fashion before making a higher high in February last year. Of course, after that a broad selloff began resulting in an almost 20% decline in the S&P 500 from its peak.
While this ETF only goes back to 2023, we can also look at the individual stocks within the magnificent 7 and see that many of them peaked in late 2021 a few months before the eventual peak in the S&P 500 at the turn of the year 2021-2022. This preceded the bear market of 2022 with the S&P dropping about 27% over 10 months.
One of the concerns dragging some of these tech stocks down is the massive spending on artificial intelligence and the data center buildout. The high amounts of capital expenditure these companies are doing was at first celebrated in the last couple of years but is now a cause for concern. Especially as they now have begun to turn to the debt markets and financing to fund some of the spending. Investors are certainly more cautious now about what the end result and return on investment will be from this spending.
I highlighted at the end of 2025 some of the different things going against the market this year and those remain a concern. The lack of participation from these tech stocks to start the year is another red flag. Rotation within the market is healthy, but we still need participation from these leaders to keep the indexes trending in the right direction. Recent history shows the importance of the market generals.
Cory McPherson is a financial planner and advisor, and President and CEO for ProActive Capital Management, Inc. He is a graduate of Kansas State University with a Bachelor of Science in Business Finance. Cory received his Retirement Income Certified Professional (RICP®) designation from The American College of Financial Services in 2017.
DISCLOSURE
ProActive Capital Management, Inc. (PCM”) is registered with the Securities and Exchange Commission. Such registration does not imply a certain level of skill or training.
The information or position herein may change from time to time without notice, and PCM has no obligation to update this material. The information herein has been provided for illustrative and informational purposes only and is not intended to serve as investment advice or as a recommendation for the purchase or sale of any security. The information herein is not specific to any individual's personal circumstances.
PCM does not provide tax or legal advice. To the extent that any material herein concerns tax or legal matters, such information is not intended to be solely relied upon nor used for the purpose of making tax and/or legal decisions without first seeking independent advice from a tax and/or legal professional.
All investments involve risk, including loss of principal invested. Past performance does not guarantee future performance. This commentary is prepared only for clients whose accounts are managed by our tactical management team at PCM. No strategy can guarantee a profit.
All investment strategies involve risk, including the risk of principal loss.
This commentary is designed to enhance our lines of communication and to provide you with timely, interesting, and thought-provoking information. You are invited and encouraged to respond with any questions or concerns you may have about your investments or just to keep us informed if your goals and objectives change.