By Cory McPherson
December 2025
After another year of positive markets in 2025, we now turn the calendar and wonder what 2026 will bring. While we saw plenty of cautionary signs this year, the stock market climbed its wall of worry to new heights. How long can this continue is the question on everyone’s mind as wall street and main street don’t agree on how things look. In this newsletter, I’ll review some important charts I’ll be watching and what may be in store for 2026.
Starting out, I wanted to review the S&P 500 chart over the last 12 months. As you can see, despite a near 20% drop early in the year, the market recovered and has made an abnormal year look normal. If we had stayed on the trend we were in to start the year, this is about the area it would have projected to finish the year at. It just took a very different route to get here with the sudden drop and rapid recovery from the first half of the year.
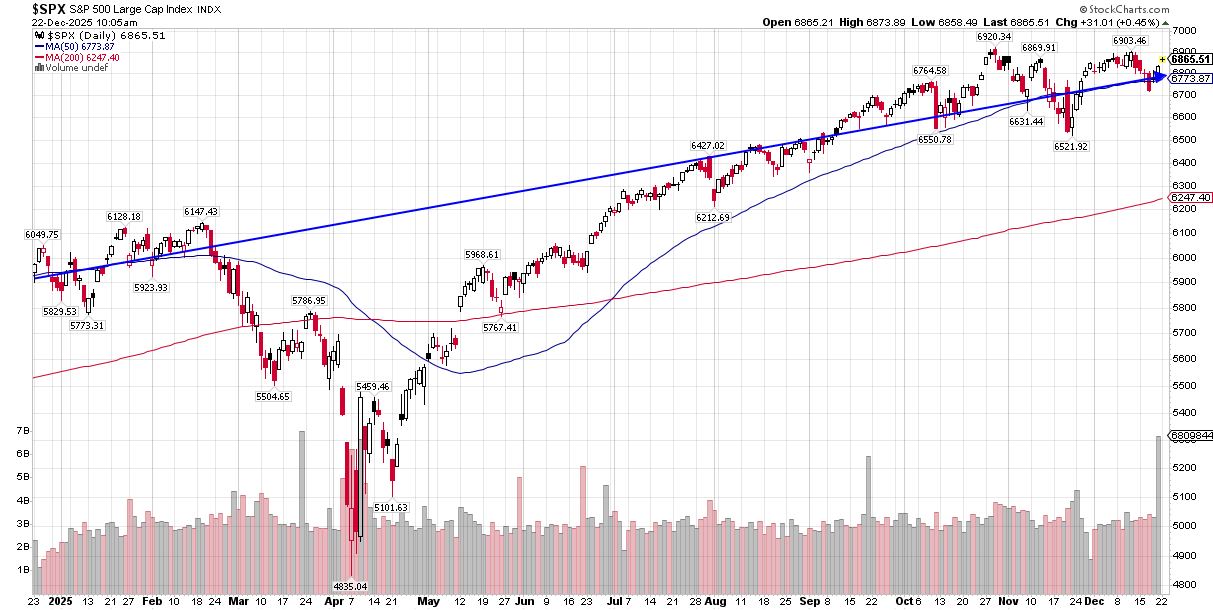
Momentum in the market has definitely slowed the last couple of months. It had a drop below its 50-day moving average in November for the first time since April, which ended up being a just short of a 6% pullback. It is now sitting just off its highs as it continues a sideways pattern of consolidation going back over 2 months. It’s hard to bet against the market right now, and if you are looking at this chart in a positive light going forward this period of consolidation could be viewed favorably and leading to a continued uptrend. You can also view it with the slowing momentum that we may be reaching a point of exhaustion in the near future and that the market is going through a topping pattern as it struggles to make new highs.
A chart that displays this possible exhaustion is this long-term chart of the S&P 500. From the 2009 lows when this long-term bull market began, the market has for the most part stayed in this channel between the blue lines. You can see in the second half of 2021 when the market went above this channel for a few months. That of course led to a period of weakness in 2022 when the market dropped almost 28%. We are now bumping up against this channel line. While we could see it push through for a period of time like in 2021, this will ultimately lead to some sort of corrective move lower at the least. The bottom channel line will also be important to watch in any future move lower. A sustained break below with a failure to get back above would signal a long-term trend change from this bull market that started in 2009.

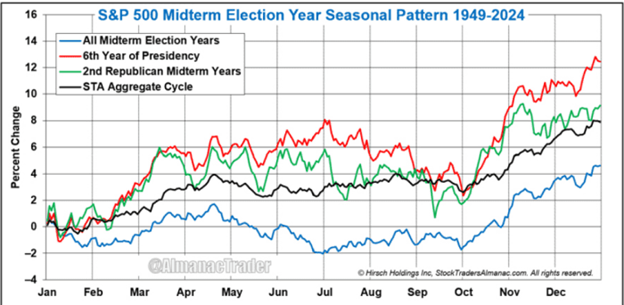
As we enter 2026, this is the 2nd year of the 4-year presidential cycle which has historically been the weakest. The last two occurrences being 2022 and 2018, both volatile and weak calendar years for the market. According to Ned Davis Research, the 2nd year of the 4-year term has an average gain of 4.6% since 1948 and has posted a positive return only 58% of the time. Historically, though, things look better when it’s in a President’s second term which we have right now. You can also see from the chart below that the first half of the year is typically weaker with a rebound happening in the 4th quarter on average.
Barring a sudden drop in these last few trading days of the year, this will be the third year in a row of double-digit price returns for the S&P 500. The last time we had 3 years in a row of double-digit returns was 2019-2021, which of course then led to 2022 where it had a loss of almost 20% that year. Before that we had 3 years in a row of double-digit returns from 2012-2014 and then a small loss in 2015. Again, this is another sign of exhaustion in the market that could set up for a more volatile 2026. With that though, if we go back to the late stages of the tech bubble of the 1990’s, we had 5(!) years in a row of double-digit returns between 1995-1999. If we are truly in the middle of an A.I.-induced bubble similar to the late 1990’s tech bubble, then we may have more time before it ultimately pops.
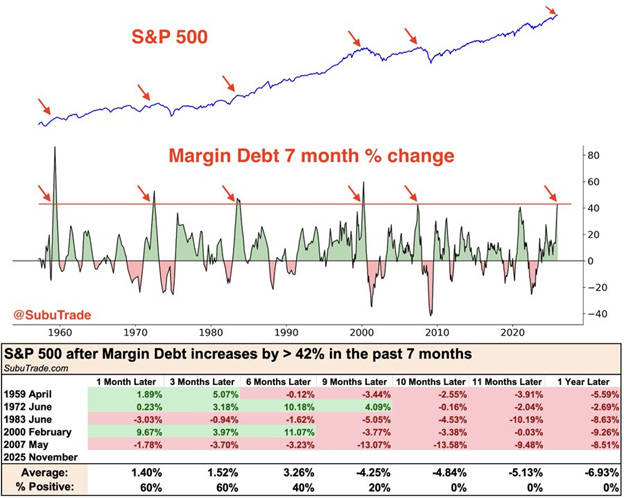
Another cautionary sign continues to be margin debt. I highlighted a few months ago how margin debt is hitting new highs in different ways that it is measured. Margin debt is what investors borrow from their brokerage firm to be able to buy more stocks for their account, allowing them to invest more. Margin debt typically spikes and then begins to see a drop before important market tops. The last few months have seen margin debt continue to rise, so no drop yet that would signal a potential change in the market. We have seen margin debt increase by more than 42% in the past 7 months, and as the chart below shows, forward returns 9+ months out don’t look great when this has happened historically.
To show how wall street and main street don’t agree with how things look currently, the University of Michigan’s consumer sentiment survey below remains near its lowest reading. It is below levels seen during the great recession in 2008-2009 and near where it was in 2022 and in the high inflation period of 1980.
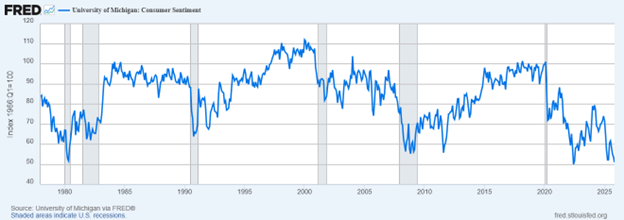
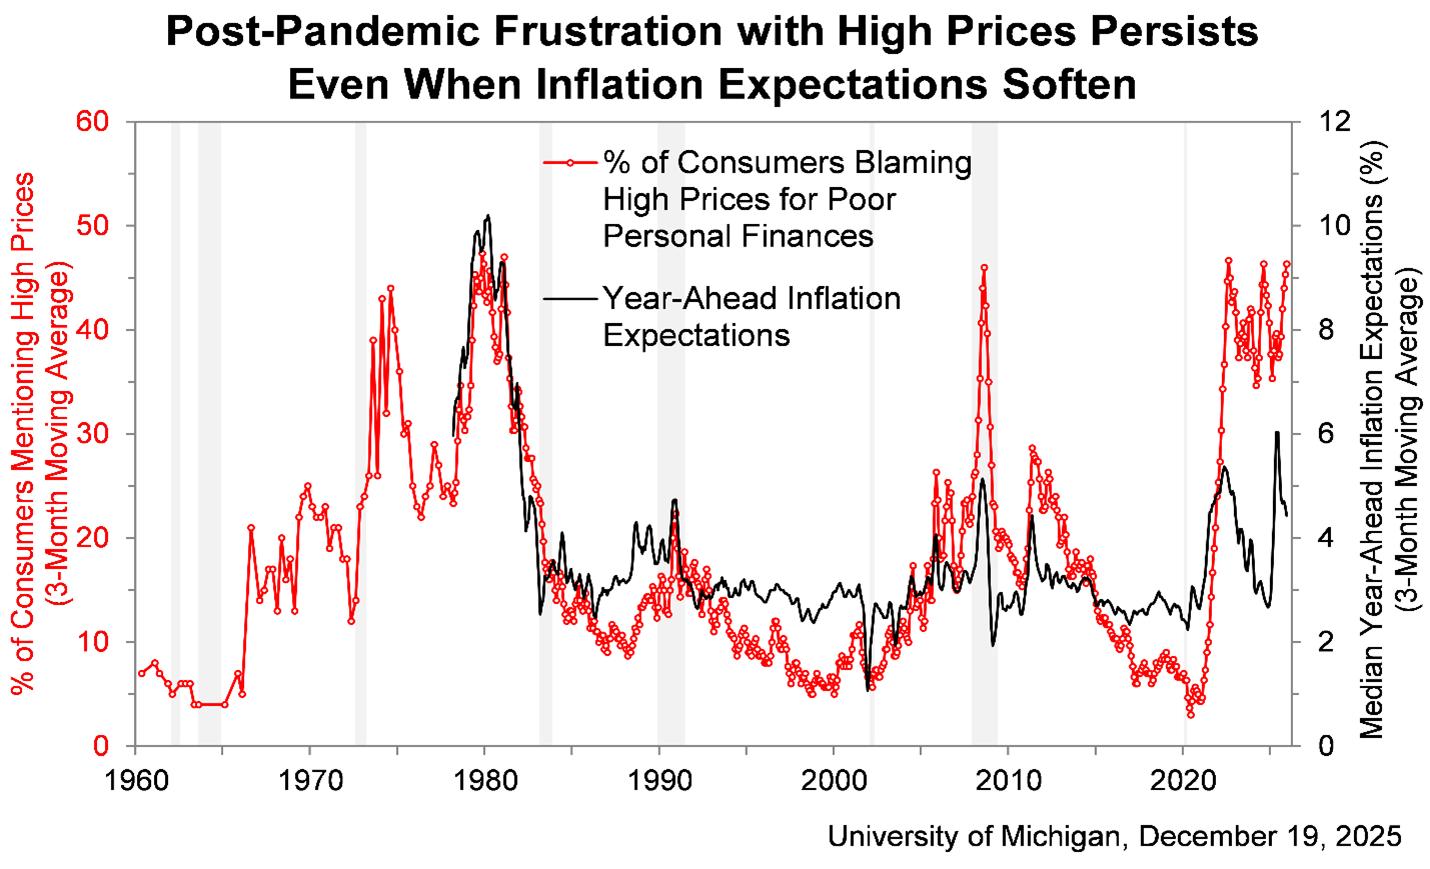
High prices continue to be a problem for everyday people and they continue to affect sentiment. This survey shows that with the only period of similar poor sentiment being the late 1970’s early 1980’s that was marked by high inflation and affordability problems. Could it be nearing a bottom and a turn around in sentiment? The chart below shows that year-ahead inflation expectations of consumers has come down over the last few months, even as consumers continue blaming high prices for poor personal finances.
We wanted to thank everyone for their continued trust in our firm as we continue to navigate uncertain times together. From our family to yours, we wish everyone a Merry Christmas and a happy and healthy New Year! We look forward to our continued relationships in 2026.
Cory McPherson is a financial planner and advisor, and President and CEO for ProActive Capital Management, Inc. He is a graduate of Kansas State University with a Bachelor of Science in Business Finance. Cory received his Retirement Income Certified Professional (RICP®) designation from The American College of Financial Services in 2017.
DISCLOSURE
ProActive Capital Management, Inc. (PCM”) is registered with the Securities and Exchange Commission. Such registration does not imply a certain level of skill or training.
The information or position herein may change from time to time without notice, and PCM has no obligation to update this material. The information herein has been provided for illustrative and informational purposes only and is not intended to serve as investment advice or as a recommendation for the purchase or sale of any security. The information herein is not specific to any individual's personal circumstances.
PCM does not provide tax or legal advice. To the extent that any material herein concerns tax or legal matters, such information is not intended to be solely relied upon nor used for the purpose of making tax and/or legal decisions without first seeking independent advice from a tax and/or legal professional.
All investments involve risk, including loss of principal invested. Past performance does not guarantee future performance. This commentary is prepared only for clients whose accounts are managed by our tactical management team at PCM. No strategy can guarantee a profit.
All investment strategies involve risk, including the risk of principal loss.
This commentary is designed to enhance our lines of communication and to provide you with timely, interesting, and thought-provoking information. You are invited and encouraged to respond with any questions or concerns you may have about your investments or just to keep us informed if your goals and objectives change.