

By Cory McPherson
September 15, 2026
September has historically been the weakest month of the year for the stock market. About halfway through the month and the S&P 500 has leaked lower, but no major weakness so far. The general trend since the beginning of June has continued with the market going sideways. After a big 4-day advance at the end of July/beginning of August, the S&P 500 has slowly leaked lower and gotten back to where it was at the beginning of June. This year has been marked by rotation, as money has continuously moved between different sectors of the market. It has attributed to the choppiness in the indexes outside of the big advance in April/May that was led by the semiconductors. In this newsletter I’ll review some charts on the S&P 500 and take another look at interest rates, which have continued to climb on the long end of the curve with an important Federal Reserve meeting looming this week.
In the S&P 500 chart below, we are looking back 12 months and while the general trend has been positive over the time period, a lot of back-and-forth action has taken place. Currently, it sits on its 50-day moving average with that positive one-year trend in place. There’s been a lot of different things thrown at the market this year that had the chance to derail the indexes, yet price has remained resilient.
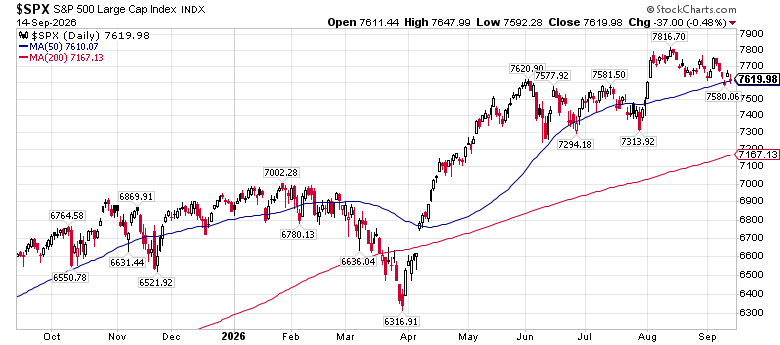
Outside of the advance though in April and May, the movement has been sideways in the months before April/May, and the months since. A lack of leadership in the market is one of the reasons. As discussed in previous newsletters this year, semiconductors were driving it during the advance of April/May. Outside of that period the market has been leaderless and resulted in the choppy action. The positive is that while money has rotated between different sectors, it has remained in the market and not leaving. While semiconductors have corrected lower, the S&P 500 has remained near its highs because money has stayed in the market and continues to rotate. Investors are just unsure of where to keep it right now.
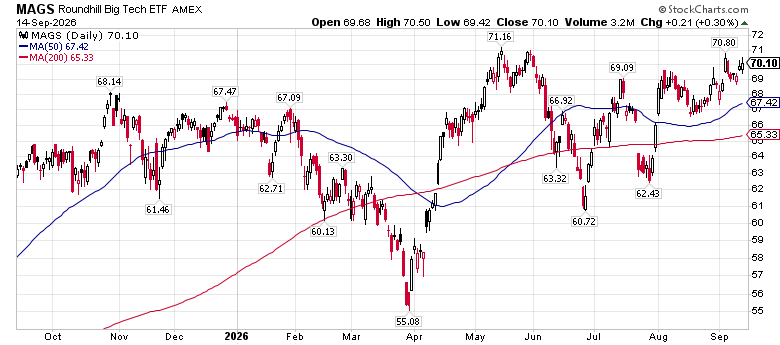
The traditional leaders of this bull market, the big technology stocks (Apple, Microsoft, Google, Nvidia, etc.) have continued to move sideways for the most part. The exchange-traded fund tracking the magnificent 7 tech stocks is shown below. It has seen its fair share of ups and downs over the last year and is also a big reason for the sideways action in the S&P. It has seen a nice bounce since the end of July as it nears its highs of the year. If it can break through, we could see leadership rotating back to these big tech names.
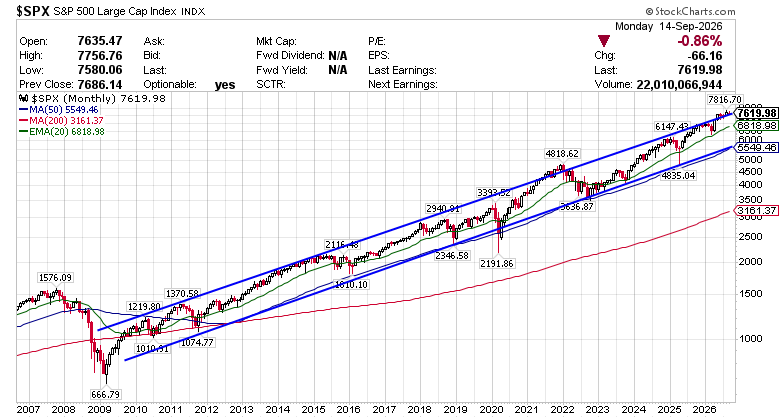
Looking at the long-term chart on the S&P 500 shows based on the history of this bull market since 2009 we may be coming upon a period of weakness. I’ve highlighted this chart in previous newsletters as it shows the S&P 500 on a monthly basis going back 20 years. Since 2009 the market has generally traded between the two blue lines in an up-trending fashion. You can see we now sit just above the upper line of the channel, similar to late 2021. What this suggests is the laws of gravity will come into play at some point bringing us back down into the channel, whether that be in the middle or bottom portion remains to be seen. A correction that takes time is also overdue. We’ve seen drops in the market since the end of 2022 and some of them violent, but they have been very short lived with the market bouncing back and recovering quickly.
In my last newsletter I reviewed interest rates on the long end of the curve and the rise they have had throughout this year. Since then that rise has only continued. The 10-year treasury yield touched 5% intra-day Monday, September 14th. The 5% level is seen as important to watch as rates peaked there in late 2023 before easing off some. If it can pierce that 5% level and continue higher we’ll be looking at rates on the 10-year not seen since 2007.
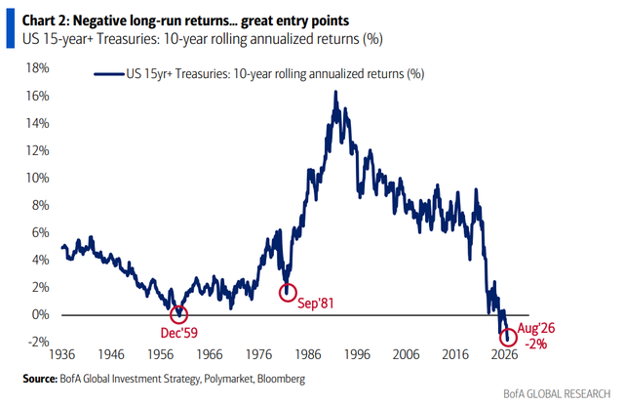
One interesting chart highlighting the weakness in long-term Treasuries comes from Michael Hartnett of Bank of America shown below. It shows the 10-year annualized return on U.S. Treasuries with maturities of 15 years or longer. It currently sits at a negative 2%, which is the weakest 10-year performance over the last 100 years. It goes without saying that it can always get worse. Especially considering interest rates are currently at a more normal level historically speaking and not any extreme high. What was extreme was the period of rates being near zero for so long, leading to negative performance in these long-dated Treasury bonds as rates went up.
All this leads to an important Federal Reserve meeting happening this week where it is expected they will raise their benchmark interest rate. The last increase made by the Fed came in July of 2023 putting their benchmark rate at 5.25%-5.50%. That marked the height of their hiking cycle that started in 2022. Since then, they have cut it 6 different times bringing it to its current level of 3.50%-3.75%. Odds favor a 0.25% hike in their benchmark rate as they have watched inflation numbers pick back up this year. The problem for the Fed is their increase in interest rates will have a minimal effect on inflation if oil and gas prices don’t come down. But they have been left with almost no choice as interest rates have already moved higher across the board forcing the Fed to follow. Ideally, a hike from the Fed will ease some of the pressure on the long end of the curve. Interestingly, the 10-year treasury yield bottomed around the same time the Fed began cutting rates in 2024. Will this Fed hike mark a top in the 10-year yield? The Fed meeting this week could certainly serve as a catalyst for many things moving forward.
Cory McPherson is a financial planner and advisor, and President and CEO for ProActive Capital Management, Inc. He is a graduate of Kansas State University with a Bachelor of Science in Business Finance. Cory received his Retirement Income Certified Professional (RICP®) designation from The American College of Financial Services in 2017.
DISCLOSURE
ProActive Capital Management, Inc. (PCM”) is registered with the Securities and Exchange Commission. Such registration does not imply a certain level of skill or training.
The information or position herein may change from time to time without notice, and PCM has no obligation to update this material. The information herein has been provided for illustrative and informational purposes only and is not intended to serve as investment advice or as a recommendation for the purchase or sale of any security. The information herein is not specific to any individual's personal circumstances.
PCM does not provide tax or legal advice. To the extent that any material herein concerns tax or legal matters, such information is not intended to be solely relied upon nor used for the purpose of making tax and/or legal decisions without first seeking independent advice from a tax and/or legal professional.
All investments involve risk, including loss of principal invested. Past performance does not guarantee future performance. This commentary is prepared only for clients whose accounts are managed by our tactical management team at PCM. No strategy can guarantee a profit.
All investment strategies involve risk, including the risk of principal loss.
This commentary is designed to enhance our lines of communication and to provide you with timely, interesting, and thought-provoking information. You are invited and encouraged to respond with any questions or concerns you may have about your investments or just to keep us informed if your goals and objectives change.