September 30, 2025

By Cory McPherson
September 2025
Signs of market froth continue to appear, as margin debt has reached a new record high. That and other indications show investors risk appetite continuing to grow. The stock market has continued to stretch higher this month and continues to set records both in price and in some valuation metrics. While this is no reason to fight the stock market, it’s also not a great time to be going all in on the stock market. In this newsletter I’ll review some of the recent margin debt figures and some economic figures that continue to suggest caution.
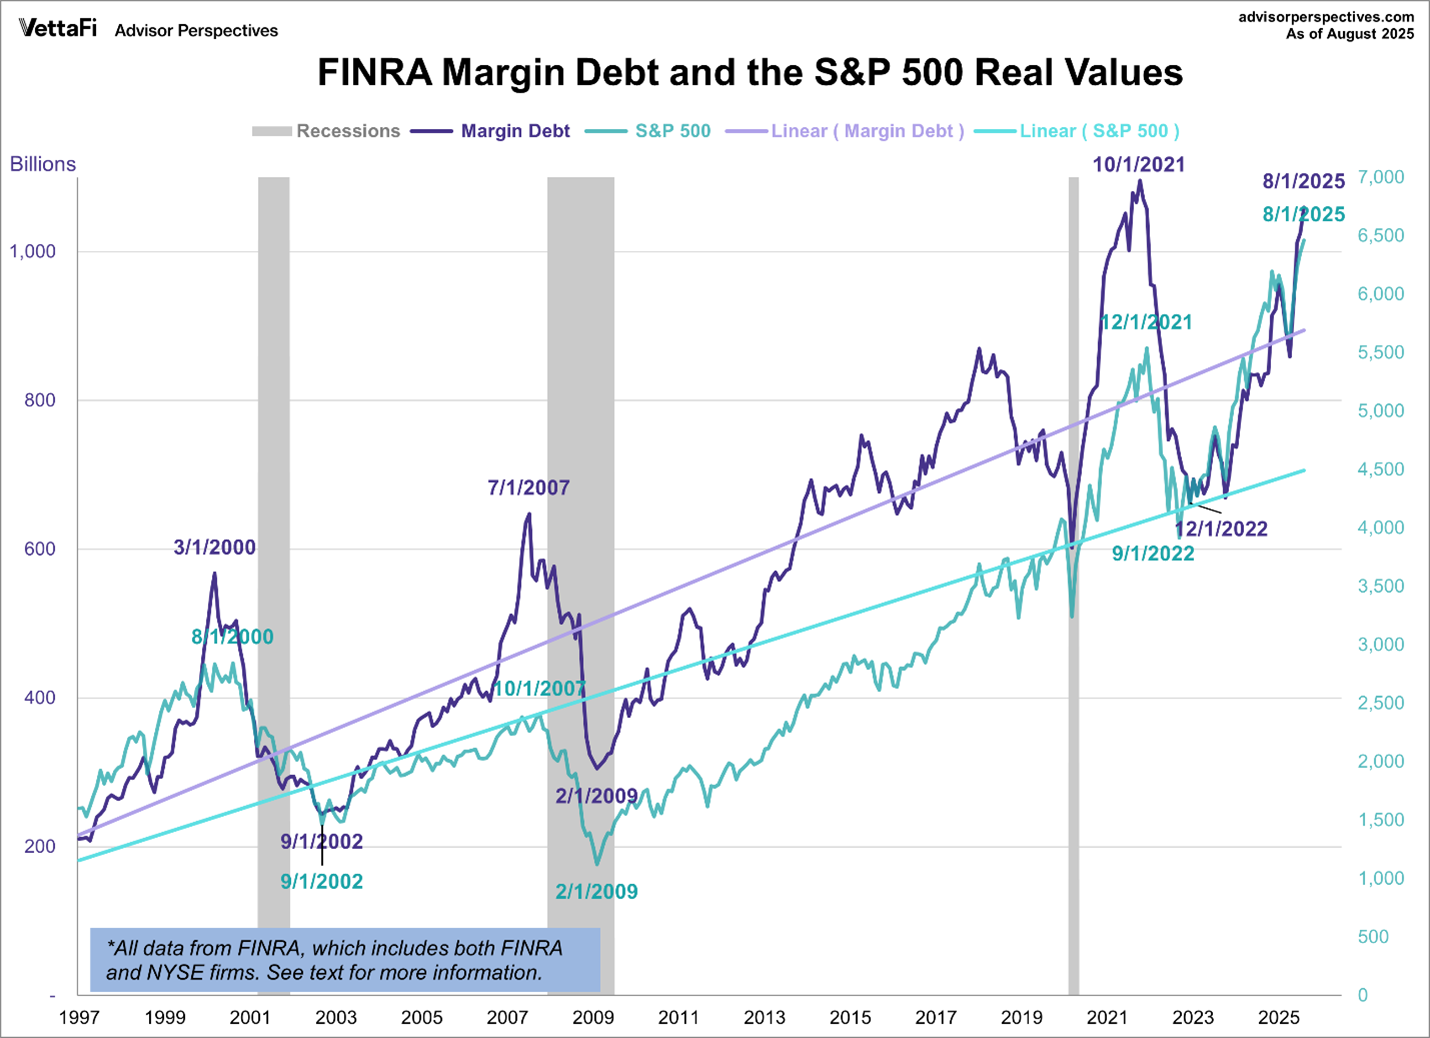
Margin debt is what investors borrow from their brokerage firm to be able to buy more securities (stocks typically) in their brokerage account. This allows them to invest more than what they are able to with what they have in cash. The debt then is backed by the securities that they own. When stocks are going up this allows investors to earn more money. It is typical to see margin debt reach new heights as the stock market goes higher. You also see periods where it can almost go parabolic in the late stages before an important market top. Margin debt in dollar terms reached a new all-time high in August at $1.06 trillion according to the latest data from FINRA. That is almost 33% higher compared to one year ago. When adjusted for inflation (CPI) it is near levels seen in late 2021 as shown in the chart below.
There’s a couple of other ways to look at margin debt as well and where we are at historically. One is putting it relative to nominal GDP (gross domestic product). From the August numbers, margin debt relative to nominal GDP sits at 3.48%. The record high reading was 3.97% in October 2021. For historical context though, the peak in that ratio was 2.6% in the dot-com bubble days in 2000, and 2.5% in 2007 before the great recession.
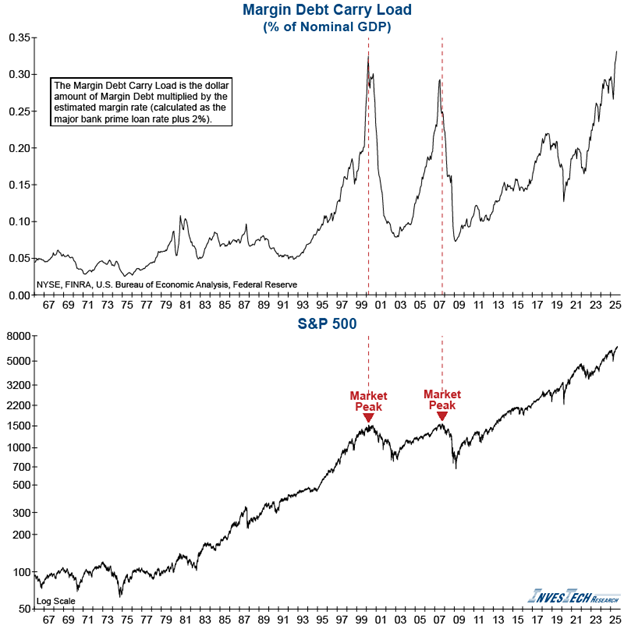
Another way to look at is Margin Debt Carry Load. This factors in the interest being paid on the margin debt. The chart below shows the dollar amount of margin debt multiplied by the estimated margin rate, which is calculated as the major bank prime rate plus 2%. This is then put in % of nominal GDP. You can see we have now reached levels seen during the last stages of the dot-com bubble days in 2000. Margin debt, though, is definitely not a timing indicator. This can continue to get higher and higher, just as the stock market can. What it can do, though, is create violent downturns in the market. When an investor owns stock on margin and that stock goes down a certain amount, the brokerage forces the investor to sell, which can create an elevator down affect, similar to what we saw in April of this year.
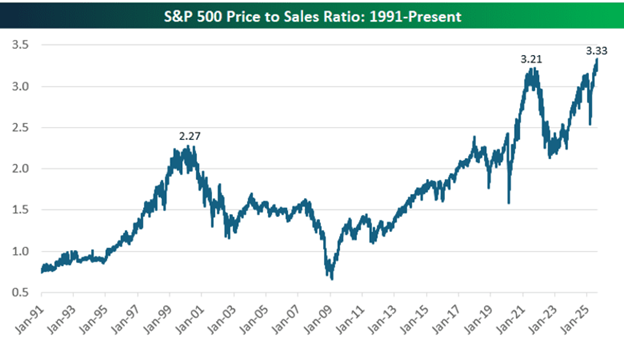
A fundamental metric on the stock market has also reached extreme heights recently. The price to sales ratio is a valuation metric that compares a company’s stock price to its revenue. Basically, a measure of what investors are willing to pay for each dollar of sales from a company. In looking at the price to sales ratio of the S&P 500 (taking the market cap of the S&P 500 and dividing by the total sales of all companies in the S&P 500 over the past 12 months), you can see we’ve surpassed last year’s and 2021’s peak in the ratio. It is also way past the peak that was seen in the dot-com bubble days, which is thought to be one of if not the biggest stock market bubbles in history. Much of this is being driven of course by technology stocks and the AI boom we’ve seen over the last few years. Stock prices have got way ahead of actual sales. While overvaluation doesn’t cause market drops or bear markets, they do often precede them.
Earlier this month we also got some concerning economic data. Over the last few years while there has been economic data suggesting a slowing economy, jobs and unemployment data remained steady. But for the second year in a row, the Labor Department announced in their annual revision to nonfarm payrolls data a huge negative revision for the period of April 2024 to March 2025. They announced a drop of 911,000 jobs created from their initial estimates over that time period. This was the largest annual revision on record. Historically, revisions at these levels are seen at the end of recessions, as the data is backwards looking. The only other time close to this level of revision was 2009. It is odd to see this happening without any official recession. Job growth over the June-August period has also been slower, averaging a growth of about 29,000 jobs/month. We’ve also seen the unemployment rate reach 4.3% as it has slowly climbed higher over the last couple of years.
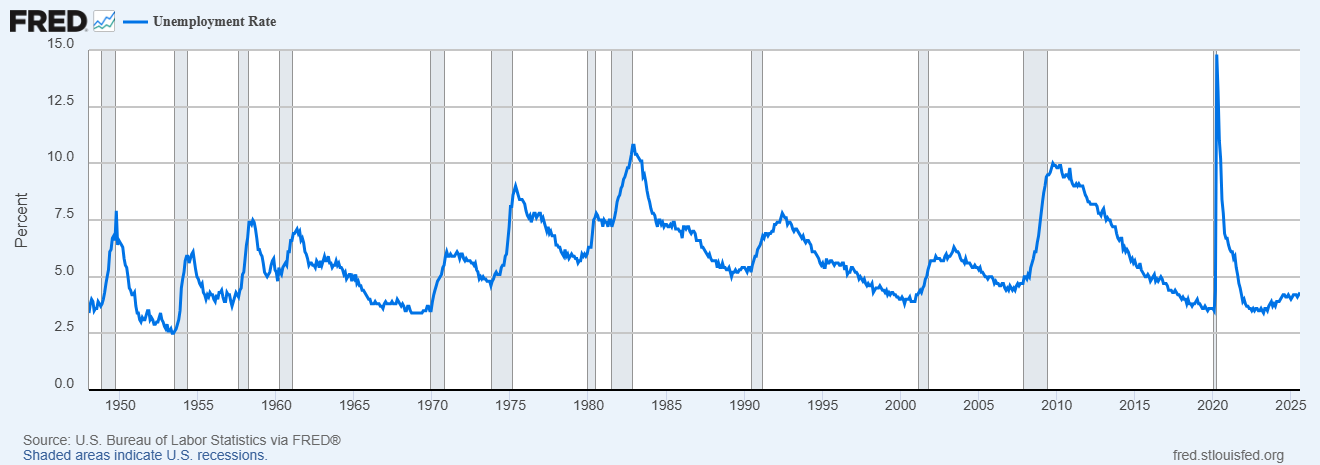
You can see in the chart above, historically when unemployment goes up it doesn’t stop until we go through a recession and it ultimately peaks. What’s odd about this time is that it is moving up slowly. In past instances it didn’t move up slowly for very long and ultimately rises in rapid fashion before peaking.
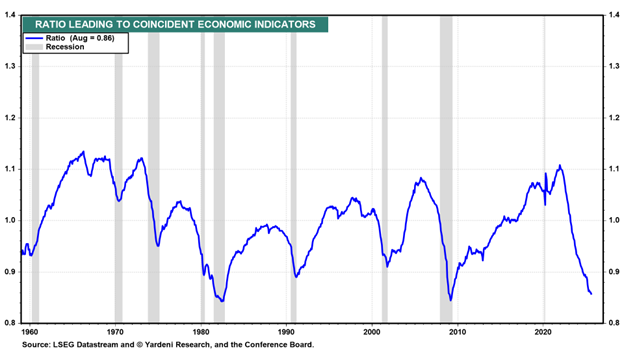
Another measure of the economy is looking at the leading to coincident economic index ratio, produced by The Conference Board. This ratio compares the leading economic index to the coincident economic index. The leading index is meant to provide an early indication of turning points in the business cycle and where the economy is heading in the near term. The coincident index is meant to provide a look at the current state of the economy. Historically, leading indicators always drop before recessions while the coincident index keeps going higher or remains steady. This leads to the ratio dropping as shown in the chart below. Leading indicators have been dropping for over 3 years now while the coincident index continues to climb. This has led to the ratio dropping to levels not seen since 2008-2009. Obviously as the chart shows, it is abnormal to see this drop without a recession having occurred. Is this time different? It certainly could be and these indicators don’t work this time. We could eventually see a rebound in these indicators and be able to stave off any recession. History wouldn’t suggest that, and if these indicators turn out to be right, it could be quite painful.
While warning signs remain abundant, you can’t argue with price. The trend higher for the stock market has continued from the bottom in April. Not even the month of September, which is historically the worst month of the year for the stock market, has been able to slow it down. Now it enters a period, the 4th quarter, which is historically much more positive. Will an imminent government shutdown cause volatility and a market drop? So far there isn’t evidence that it will. The old saying that markets can stay irrational much longer than you can stay solvent, definitely applies.
Cory McPherson is a financial planner and advisor, and President and CEO for ProActive Capital Management, Inc. He is a graduate of Kansas State University with a Bachelor of Science in Business Finance. Cory received his Retirement Income Certified Professional (RICP®) designation from The American College of Financial Services in 2017.
DISCLOSURE
ProActive Capital Management, Inc. (PCM”) is registered with the Securities and Exchange Commission. Such registration does not imply a certain level of skill or training.
The information or position herein may change from time to time without notice, and PCM has no obligation to update this material. The information herein has been provided for illustrative and informational purposes only and is not intended to serve as investment advice or as a recommendation for the purchase or sale of any security. The information herein is not specific to any individual's personal circumstances.
PCM does not provide tax or legal advice. To the extent that any material herein concerns tax or legal matters, such information is not intended to be solely relied upon nor used for the purpose of making tax and/or legal decisions without first seeking independent advice from a tax and/or legal professional.
All investments involve risk, including loss of principal invested. Past performance does not guarantee future performance. This commentary is prepared only for clients whose accounts are managed by our tactical management team at PCM. No strategy can guarantee a profit.
All investment strategies involve risk, including the risk of principal loss.
This commentary is designed to enhance our lines of communication and to provide you with timely, interesting, and thought-provoking information. You are invited and encouraged to respond with any questions or concerns you may have about your investments or just to keep us informed if your goals and objectives change.